
It is a simple fact, and one that is remarkably little understood, that delays in port make for poor vessel schedule reliability.
We say it is remarkably little understood because several executives of our acquaintance have asked us why ships are not meeting windows as much anymore. One senior executive, during COVID, criticised shipping for frequently being late – this was just an attempt, in our view, to take the focus off the fact that ports around the world couldn’t cope with the surge in traffic.
Before we get into it, remember, it’s rare for ships to be delayed at sea. The ocean space above the water is mostly open, vast, and largely free of blockages. There is little impeding a ship that is going across, say, the Tasman Sea. Ships don’t get stuck in traffic jams on the High Seas nor do they have to stop at red traffic lights. Cargo ships may avoid really horrible weather systems but, if they can, they normally go straight through them. Shipping companies are generally incentivised to get from one port to another as soon as is possible. Ships generally don’t waste time by doing donuts in the sea. If ships generally prefer to move directly between ports, as they generally do, then let’s have a look at what might happen around the time of a port call, and, more interestingly, what might happen in a sequence of port calls.
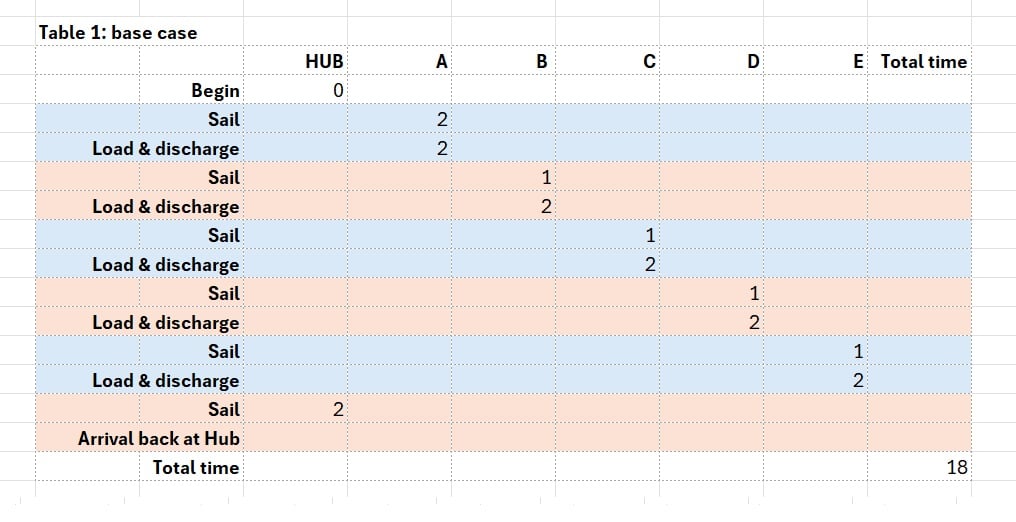
Table 1: the base case
Let’s say there is an offshore container port that is a regional hub. We will call it “Hub”. Container lines run services from the Hub to a Big Island with five main container ports on it. We will call the ports A, B, C, D, and, you guessed it, E. Let’s say a box ship of 2,500 TEU is scheduled to call at those ports in alphabetical order.
We have written that up as Table 1: base case. In the base case, we reset at every return to the Hub, there are two days of sailing between the Hub and Port A and two days of sailing from Port E back to the Hub. There are two days of container exchange at each port and one day of sailing time between each port on the Big Island. We will assume that the Hub is a paragon of virtue and never has any delay nor any bad weather.
Now let’s see how small incidents cause delays that propagate and accumulate through a loop.
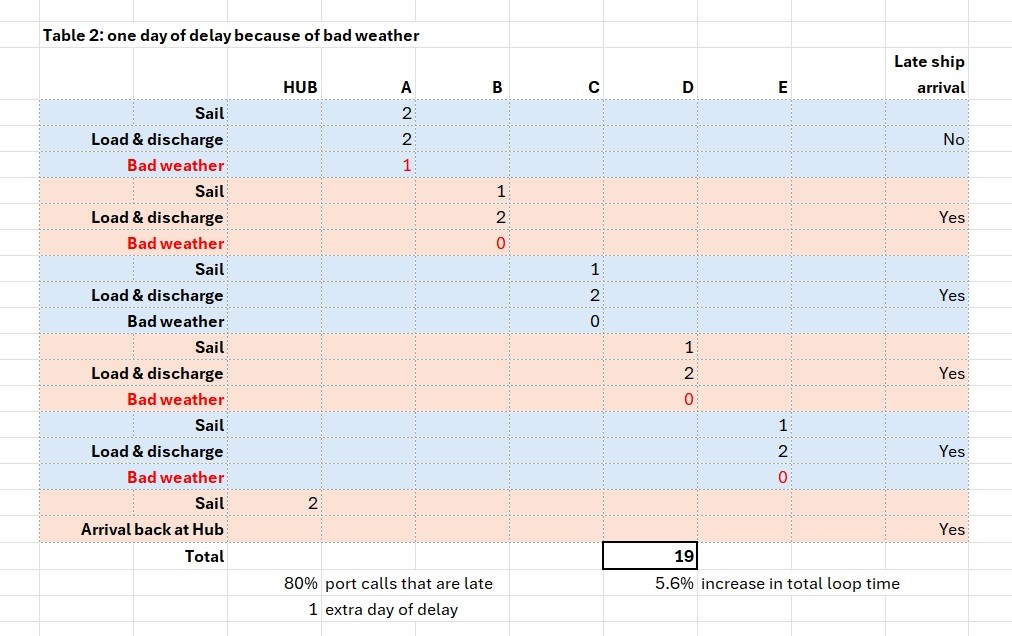
Just one day of bad weather
One day of bad weather in the loop can cause one day of delay. That one day of delay causes a 5.6% increase in total loop-time and can make a ship late on its port calls 80% of the time on the Big Island, as you can see from Table 2. In our simplified model we reset each loop at the Hub. But, in reality, if there is always one day of bad weather somewhere in the loop, then the 5.6% increase in total loop time will get worse. Ships will get later and later, right up until the point that there is a corrective action (that could be speeding up ship, skipping a port, blanking a sailing or some other measure). Always keep in mind that this is a simplified model. We haven’t shown how, say, arriving late at B might cause a ship to completely miss its window and be forced to wait an extra day or two, causing the same ship to miss its windows at C, D, E.
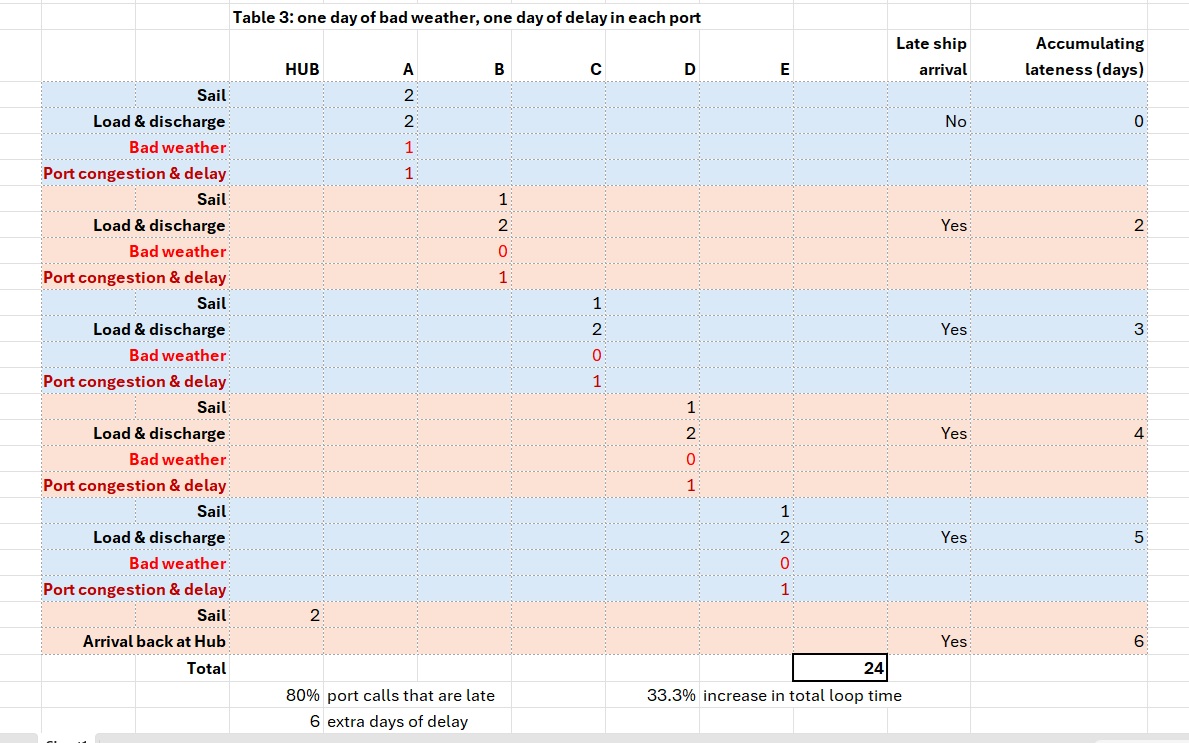
One day of bad weather, one day of delay in each Big Island port
If there is one day of bad weather, and one day of delay in each island port, then the statistics blow out as you will see from Table 3. You can see the schedule reliability deteriorating port call-by-port call. The number of days of delay in the loop leaps from one day of delay to six days of delay. Any given ship will be late 80% of the time on the Big Island. And the total loop time rises by just over 33%.
One day of bad weather, random days of delay in each Big Island port
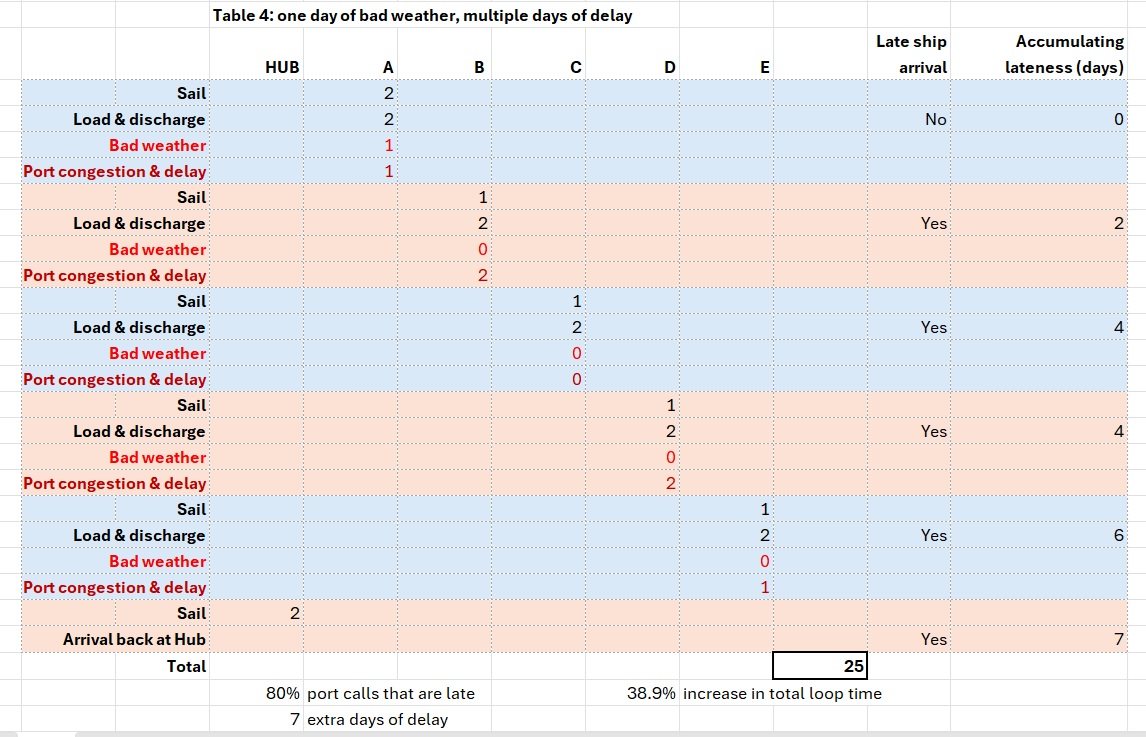
In Table 4, we have randomly assigned delays between 0 and 3 days. So, there is one day of bad weather, and six days of in-port delay. The number of days of delay in the loop rises to seven days of delay, a 38.9% increase in total loop time, and the ship will be late 80% of the time on the Big Island. If the duration of the loop has increased from 18 days to 25 days, then that represents a huge loss of capacity. Shipping lines are more likely to respond with schedule management e.g. skipping port calls to get back on time.
Lots of bad weather, lots of delay
Imagine it’s a stormy winter, with lots of bad weather on the Big Island’s east coast. Imagine, further, that there is a confluence of factors that are leading to delay. A surge in cargo imports, perhaps. Maybe it’s peak season. Maybe there is industrial action. Here, in Table 5, we have added several days of bad weather and added three days of delay at each port A, B, C, D, E.
In the Table 5 scenario, ships are late in their port calls 80% of the time on the Big Island, there is a whopping 100% increase in the total time taken to complete the loop and there are 18 days of delay in the loop in total.
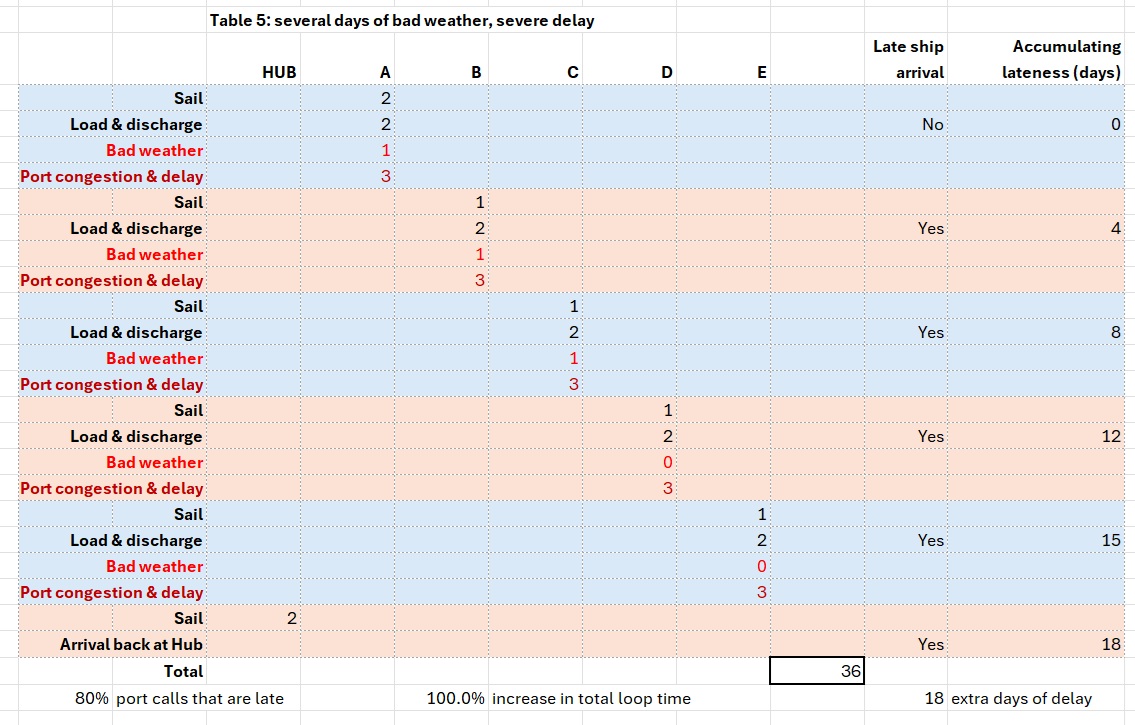
In this example, an 18-day service loop has blown out to 36 days. Think about what that might mean for effective shipping capacity, service frequency, cost, resilience, recovery, inventory management, working capital issues, and everything else that would come from such a massive delay. Shipping lines are almost certainly going to respond with blanked sailings, port omissions, speeding up of vessels (which just guzzles fuel, which is super-costly) and more.
Greatly simplified
We hope you realise that the examples given above are very highly simplified. We have presented a simplified model so that we can demonstrate what is happening and so that you can see it happening as it happens.
We’ve got some key messages for you, and we hope that the simplified model we have presented to you will help you see the truth of these messages. And they are:
- variability that occurs for any reason in a tightly interconnected scheduled system accumulates, eats up the slack, and propagates through the network
- schedule reliability is, in substantial part, an emergent property of the whole ocean freight transport system
- ocean-going carriers do not have unilateral control over everything that happens in that system
- don’t mistake the place where a system failure becomes visible for the place where the system failure originates; they are different places and things
blank line space.
We have presented a simplified model but the reality is super-complex. In reality, any given line could find one of its ships greatly delayed at one port but not at the others. Maybe there is a spell of continent-wide bad weather. Maybe there is a really intense and long-running industrial action. Maybe, and this is always a key factor, all of these things are going on simultaneously. Maybe there are a lot of issues in Asia. That directly impacts Australia because container shipping loops are operated in a variety of ways. Sometimes it’s a hub-and-spoke system, sometimes it’s interconnecting loops, and it is always changeable.
Incidentally, before we get into the current Asian congestion situation (below), you should note that we presented a very simplified model above so that we could show you the mechanism of action. In that model, we designated one day of delay as being late just so we could easily show you how it works. Reality is far more complicated than that.
We cite the analysis of the globally-respected Sea-Intelligence, below. You should be aware that under the Sea-Intelligence definition, those one-day-late arrivals would count as on-time. Remember: we presented a simple version to explain the model. Sea-Intelligence are doing the real-world analysis.
Commentators and implications
We sometimes hear executives express exasperation about ships not meeting windows. We sometimes hear of advocates calling for something to happen in some way.
The key thing to bear in mind is that there can be a huge deviation from the idealised norm, as represented in Table 1, and that’s not necessarily the fault of any particular person, group, or institution. We can probably best express that with the phrase “things happen, y’know?”.
We appreciate that some groups and institutions plan and organise based on the idealised base case. Perhaps it works for your operation. Perhaps you’re following a Just-in-Time philosophy of inventory management. Perhaps you think that it is a bit too costly to adopt a flexible model.
It’s your right to think these things. It’s your right to make decisions based on that way of thinking. It is your choice. And it is you who owns the consequences of that choice too.
So you should recognise that you’re making a trade-off. You’re spending resilience and adaptability to buy brittleness and financial savings.
Ultimately, we would suggest, those financial savings will disappear pretty quickly when things go wrong, and they will inevitably go wrong, because we live in a chaotic and random world.
When the vessel doesn’t arrive at a time that is well aligned with your operational plan, or the port doesn’t service the ships fast enough for whatever reason, then you may well be faced with a large amount of unplanned-for costs, a loss of commercial reputation, and severely disappointed customers.
The implication here, in case you need it spelled out, is that everyone in the supply chain ought to recognise that disruption is not abnormal. It’s normal. And you need to plan for it.
And, we would add, if your model of reality doesn’t align with actual reality, then it’s not reality that’s wrong. And it’s not reality that needs to change. Maybe you might want to think about adopting a more flexible and more adaptable operational model.
Current situation: Asian port congestion and just under seven days of delay
We can see a real-life example of this delay phenomenon at work in the current situation. International shipping market analysts are reporting extreme congestion in Asian ports – we ourselves have heard of nine days of delay in certain ports in Asia. This has caused global shipping reliability to “plummet” according to analysts Sea-Intelligence.
“In the backdrop of severe port congestion in Asia, global schedule declined sharply [month-on-month] for the second consecutive month, with the latest M/M decline of -5.9 percentage points dropping the August figure to 49.9%; the lowest point since September 2022. With declining schedule reliability, the average delay for LATE vessel arrivals also deteriorated, increasing M/M by 0.60 days to 6.81 days. This is the highest level reached since March 2022. On a Y/Y level, the August 2026 figure was 1.92 days higher,” says Alan Murphy, CEO, Sea-Intelligence.
Country-level vessel reliability figures are generally in decline. In August this year compared to August last year, container vessel schedule reliability in China is down 31 percentage points; Singapore down 23.4 percentage points; Malaysia down 21.7 percentage points; South Korea down 37.0 percentage points; Vietnam down 16.2 percentage points; Japan down 7.0 percentage points; Taiwan down 24.8 percentage points; Hong Kong down 28.5 percentage points; and Indonesia down 32.6 percentage points. Only Thailand is bucking the trend.
“Congestion is not a localised issue but is spread region‑wide,” Mr Murphy comments.